ggplot2 themes and color scales following the visual identity of the Annenberg Institute at Brown University.
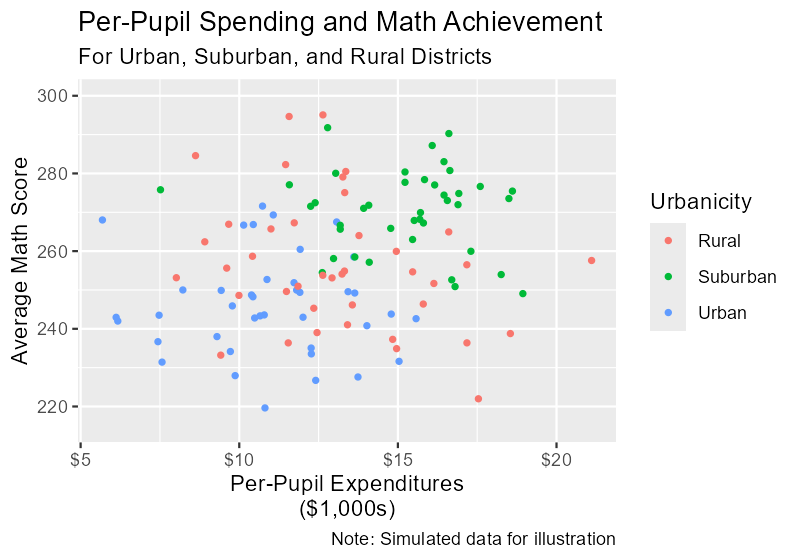
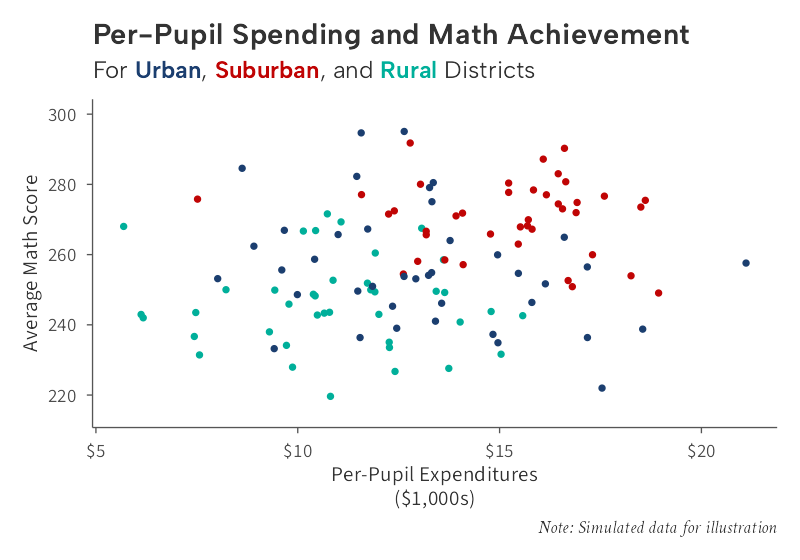
Drag to compare: default ggplot2 (left) vs. ggaib (right)
Features
- Themes — Publication, data-dense, and map variants
- Color Scales — Discrete, continuous, and diverging palettes
- Labels — Dollar, comma, and percent axis formatters
- Palettes — Direct access to brand colors
- Font System — Automatic font registration with bundled fallbacks
Get started
Read the introduction vignette for a guided tour, or browse the function reference.